Simple Techniques for Extracting Table Data from PDFs
Extracting tables from PDFs is a crucial yet challenging task, especially when dealing with complex documents and unstructured formats. Whether you are processing invoices, research papers, or reports, accurate table extraction can significantly enhance data accessibility and utility.
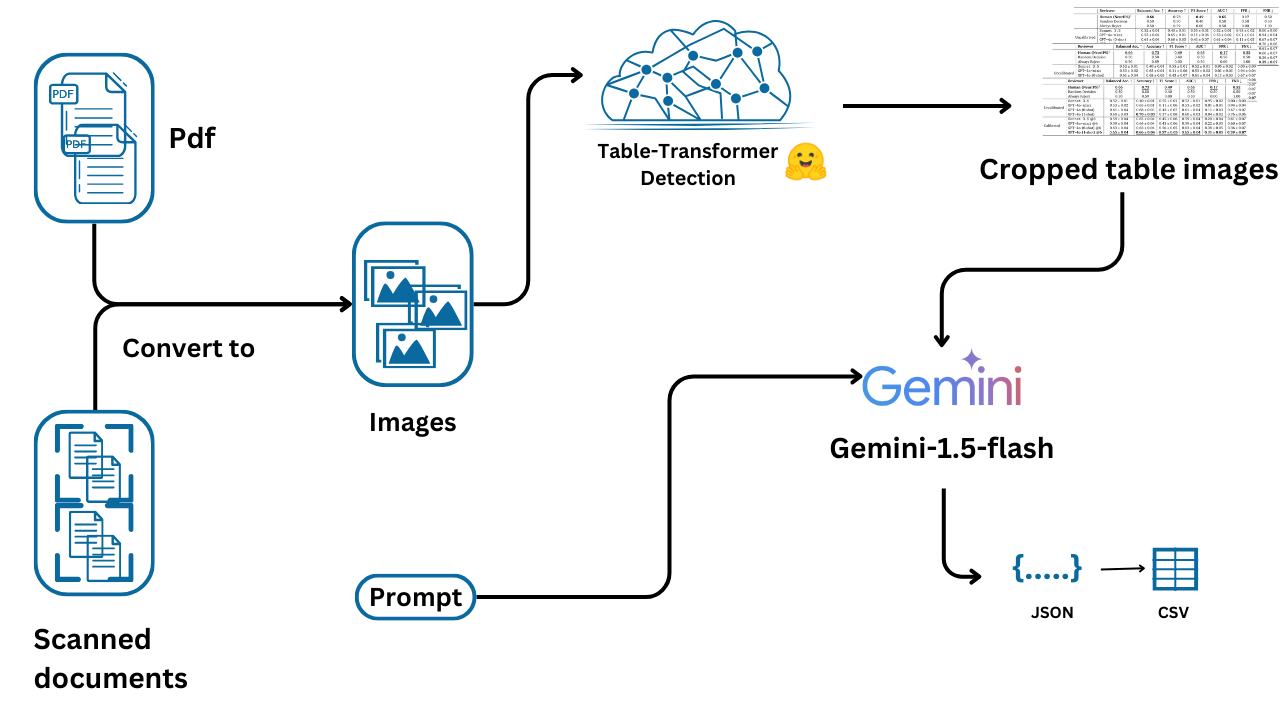
In this blog post, we’ll explore three popular approaches for table extraction: rule-based methods using libraries like Tabula-py, machine learning-driven Optical Character Recognition (OCR) techniques with Microsoft's Table Transformer, and advanced Vision Language Models (VLMs) like Google’s Gemini-1.5-Flash.
Each of these methods offers unique strengths for converting tables into structured formats like CSV, JSON, or pandas DataFrames. Understanding these approaches can provide the foundation for building systems that integrate table data into more advanced applications, such as Retrieval-Augmented Generation (RAG) for generating enriched content.
Let's dive into each of these techniques and understand how they can be leveraged for effective table extraction.
Code Examples
Using Tabula-py
Tabula-py is a Python wrapper for the Tabula Java library, which is specifically designed for extracting tables from PDFs and converting them into pandas DataFrames. This method is particularly useful when working with structured PDFs where tables are presented in a grid format.
Workflow Example
First, we install the necessary packages, tabula-py and jpype1, which are required to run Tabula’s Java backend in Python.
!pip install tabula-py jpype1
Next, we import the read_pdf function from Tabula. Here, we specify the path to the PDF file and set the pages parameter to "all" so that Tabula reads all pages of the PDF.
from tabula import read_pdf
data = read_pdf(input_path="/content/pdfs/2408.06292v2.pdf", pages="all")
The output, data, is a list of pandas DataFrames, where each DataFrame corresponds to a table detected on a specific page. You can access each DataFrame individually to further manipulate or analyze the extracted table data.
Since data is a list of DataFrames, you can easily loop through or directly access specific tables for further processing or analysis.
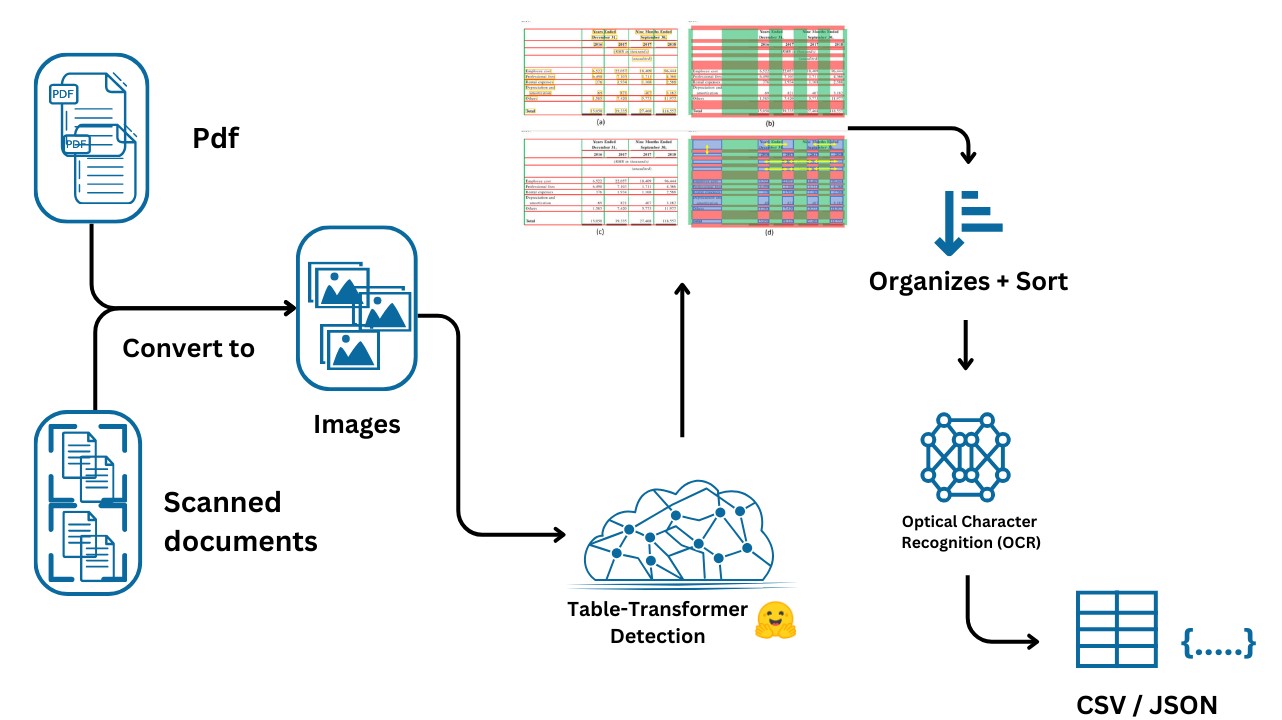
Using Optical Character Recognition (OCR)
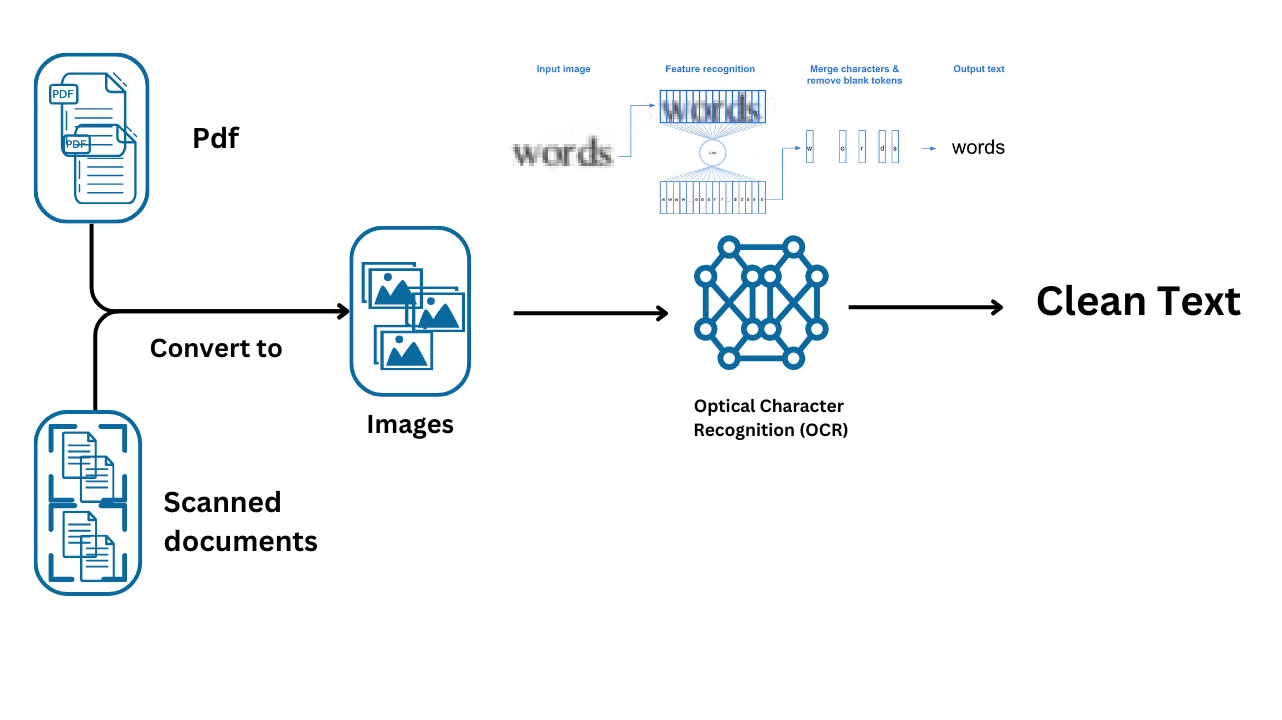
OCR is a technology used to convert different types of documents, such as scanned paper documents, PDFs, or images containing text, into machine-readable data. In this context, OCR plays a crucial role in extracting text from detected tables within a document image.
Workflow Example
First, we install the necessary libraries for OCR and PDF-to-image conversion. Tesseract is the OCR engine, while pdf2image is used to convert PDF files into images that can be processed further.
!apt install tesseract-ocr
!pip install pytesseract
!apt install -y poppler-utils
!pip install pdf2image
Next, we import various libraries, including Hugging Face’s transformers for table detection, PyTorch , and other utilities like pdf2image for converting PDFs into images, PIL for image processing, and pytesseract for OCR.
from transformers import AutoImageProcessor, TableTransformerForObjectDetection
import torch
from PIL import Image, ImageFont
import csv
import numpy as np
import pandas as pd
from pdf2image import convert_from_path
from tqdm.auto import tqdm
import pytesseract
import os
Here, we define the table detection model, microsoft/table-transformer-detection, which is specifically fine-tuned to detect tables within document images. The model is based on DETR (Detection Transformer), which is effective for detecting structured elements like tables in unstructured PDFs. We load the image processor and table detection model for further use.
detection_model_name = "microsoft/table-transformer-detection"

image_processor = AutoImageProcessor.from_pretrained(detection_model_name)

table_detection_model = TableTransformerForObjectDetection.from_pretrained(detection_model_name,
                                                           revision="no_timm")
For recognizing the internal structure of the detected tables (rows, columns, etc.), we use another model, microsoft/table-structure-recognition-v1.1-all. This model enables us to identify individual components within the table, which is critical for correctly extracting the data.
structure_model_name = "microsoft/table-structure-recognition-v1.1-all"
structure_model = TableTransformerForObjectDetection.from_pretrained(structure_model_name)
The following function converts all PDFs in a specified folder into images. This step is necessary because the models operate on images rather than PDFs directly. Each page of the PDF is converted into a separate image.
def convert_pdfs_to_images(folder_path):
    images = []

    # List all files in the folder
    for filename in os.listdir(folder_path):
        # Check if the file is a PDF
        if filename.endswith(".pdf"):
            pdf_path = os.path.join(folder_path, filename)

            # Convert PDF to list of images
            pdf_images = convert_from_path(pdf_path)
            images.extend(pdf_images)  # Add all images to the main list

    return images
Here, we define a function to detect tables within an image. The image is first preprocessed and fed into the table detection model. The output contains bounding boxes and class logits, which are converted into Pascal VOC format to make it easier to work with.
def detect_table(image_doc):

  # preproces image document
  inputs = image_processor(images = image_doc, return_tensors="pt")

  # detect tables
  outputs = table_detection_model(**inputs)

  # convert outputs (bounding boxes and class logits) to Pascal VOC format (xmin, ymin, xmax, ymax)
  target_sizes = torch.tensor([image_doc.size[::-1]])
  results = image_processor.post_process_object_detection(outputs,
                                                          threshold=0.9,
                                                          target_sizes=target_sizes)[0]

  return results
This function extracts the bounding boxes (BBOX) of detected tables from the results. We iterate through all detected elements, extract coordinates, and store them for later use.
def get_table_bbox(results):

  tables_coordinates = []

  # iterate through all the detected table data
  for score, label, box in zip(results["scores"], results["labels"], results["boxes"]):
    box = [round(i, 2) for i in box.tolist()]

    # store bbox coodinates in Pascal VOC format for later use
    table_dict = {"xmin" : box[0],
                  "ymin" : box[1],
                  "xmax" : box[2],
                  "ymax" : box[3]}

    tables_coordinates.append(table_dict)

    # print prediction label, prediction confidence score, and bbox values
    print(
        f"Detected {table_detection_model.config.id2label[label.item()]} with confidence "
        f"{round(score.item(), 3)} at location {box}"
        )

  return tables_coordinates
The function below takes the bounding boxes of tables and crops the detected areas from the original image. This step isolates the table from the rest of the image, making it easier to extract its structure and content.
def get_cropped_image(image, table, padding):
  # Create a new image object with the cropped area
  cropped_image = image.copy().crop((table["xmin"] -padding,
                             table["ymin"] - padding,
                             table["xmax"] + padding,
                             table["ymax"] + padding
                             ))

  return cropped_image
Once we have the cropped table image, we extract the table's structural features, such as rows and columns, using the structure recognition model. This function post-processes the model’s output to determine where each cell is located within the table.
def get_table_features(cropped_image):
    # preprocess image input for table transformer
    inputs = image_processor(images=cropped_image, return_tensors="pt")

    # make prediction using table transformer
    outputs = structure_model(**inputs)

    # post-process output to Pascal VOC bbox format
    target_sizes = torch.tensor([cropped_image.size[::-1]])
    results = image_processor.post_process_object_detection(outputs, threshold=0.9, target_sizes=target_sizes)[0]

    # define a list to store detected features
    features = []

    # iterate through all the detected features and store feature label, confidence score, and bbox values to cells list
    for i, (score, label, box) in enumerate(zip(results["scores"], results["labels"], results["boxes"])):
        box = [round(i, 2) for i in box.tolist()]
        score = score.item()
        label = structure_model.config.id2label[label.item()]

        cell_dict = {
            "label": label,
            "score": score,
            "bbox": box
        }

        # append the feature dictionary to the features list
        features.append(cell_dict)
        print(f"Detected {label} with confidence {round(score, 3)} at location {box}")

    return features
The function below organizes the detected table features by rows and columns, enabling precise cell extraction. We sort the rows and columns by their respective Y and X coordinates, then calculate each cell's coordinates within the table.
def get_cell_coordinates_by_row(table_data):
    # Extract rows and columns
    rows = [entry for entry in table_data if entry['label'] == 'table row']
    columns = [entry for entry in table_data if entry['label'] == 'table column']

    # Sort rows and columns by their Y and X coordinates, respectively
    rows.sort(key=lambda x: x['bbox'][1])
    columns.sort(key=lambda x: x['bbox'][0])

    # Function to find cell coordinates
    def find_cell_coordinates(row, column):
        cell_bbox = [column['bbox'][0], row['bbox'][1], column['bbox'][2], row['bbox'][3]]
        return cell_bbox

    # Generate cell coordinates and count cells in each row
    cell_coordinates = []

    for row in rows:
        row_cells = []
        for column in columns:
            cell_bbox = find_cell_coordinates(row, column)
            row_cells.append({'cell': cell_bbox})

        # Append row information to cell_coordinates
        cell_coordinates.append({'cells': row_cells, 'cell_count': len(row_cells)})

    return cell_coordinates
Here, we apply OCR to each detected cell to extract the textual content. We loop through each row and cell, crop the corresponding cell from the table image, and then use Tesseract OCR to read the text. The text is stored in a structured format for easy manipulation.
def apply_ocr(cell_coordinates, cropped_image):
    # let's OCR row by row
    data = dict()
    max_num_columns = 0
    for idx, row in enumerate(tqdm(cell_coordinates)):
        row_text = []
        for cell in row["cells"]:
            # crop cell out of image
            cell_image = np.array(cropped_image.crop(cell["cell"]))

            # apply OCR using PyTesseract
            text = pytesseract.image_to_string(cell_image, lang='eng', config='--psm 6').strip()
            if text:
                row_text.append(text)


        if len(row_text) > max_num_columns:
            max_num_columns = len(row_text)

        data[idx] = row_text

    print("Max number of columns:", max_num_columns)

    # pad rows which don't have max_num_columns elements
    for row, row_data in data.copy().items():
        if len(row_data) != max_num_columns:
            row_data = row_data + ["" for _ in range(max_num_columns - len(row_data))]
        data[row] = row_data
        print(row_data)

    return data
This final function writes the OCR-extracted data into a CSV file, allowing easy export and further analysis. Each row of the table is written to the CSV in a structured format.
def write_csv(data, table_num):
  with open(f'{table_num}.csv','w') as result_file:
      wr = csv.writer(result_file, dialect='excel')
      for row, row_text in data.items():

        wr.writerow(row_text)
Lastly, we bring everything together. We first convert PDFs into images, and then apply the entire pipeline: detecting tables, cropping the images, extracting features, performing OCR, and finally saving the results as CSV files.
folder_path = "pdfs"
all_images = convert_pdfs_to_images(folder_path)

for image_doc in tqdm(all_images):
  # Detect Tables BBOX
  results = detect_table(image_doc)
  # Get Table BBOX
  table_bbox = get_table_bbox(results)
  for table in table_bbox:
    # Crop Table Image
    cropped_image = get_cropped_image(image_doc, table, 10)
    # Extract Table Features
    table_data = get_table_features(cropped_image)
    cell_coordinates = get_cell_coordinates_by_row(table_data)
    # OCR
    data = apply_ocr(cell_coordinates, cropped_image)
    # Write CSV
    write_csv(data , target_images.index(image_doc) )
Using Vision language models (VLMs)
What is a Vision Language Model?
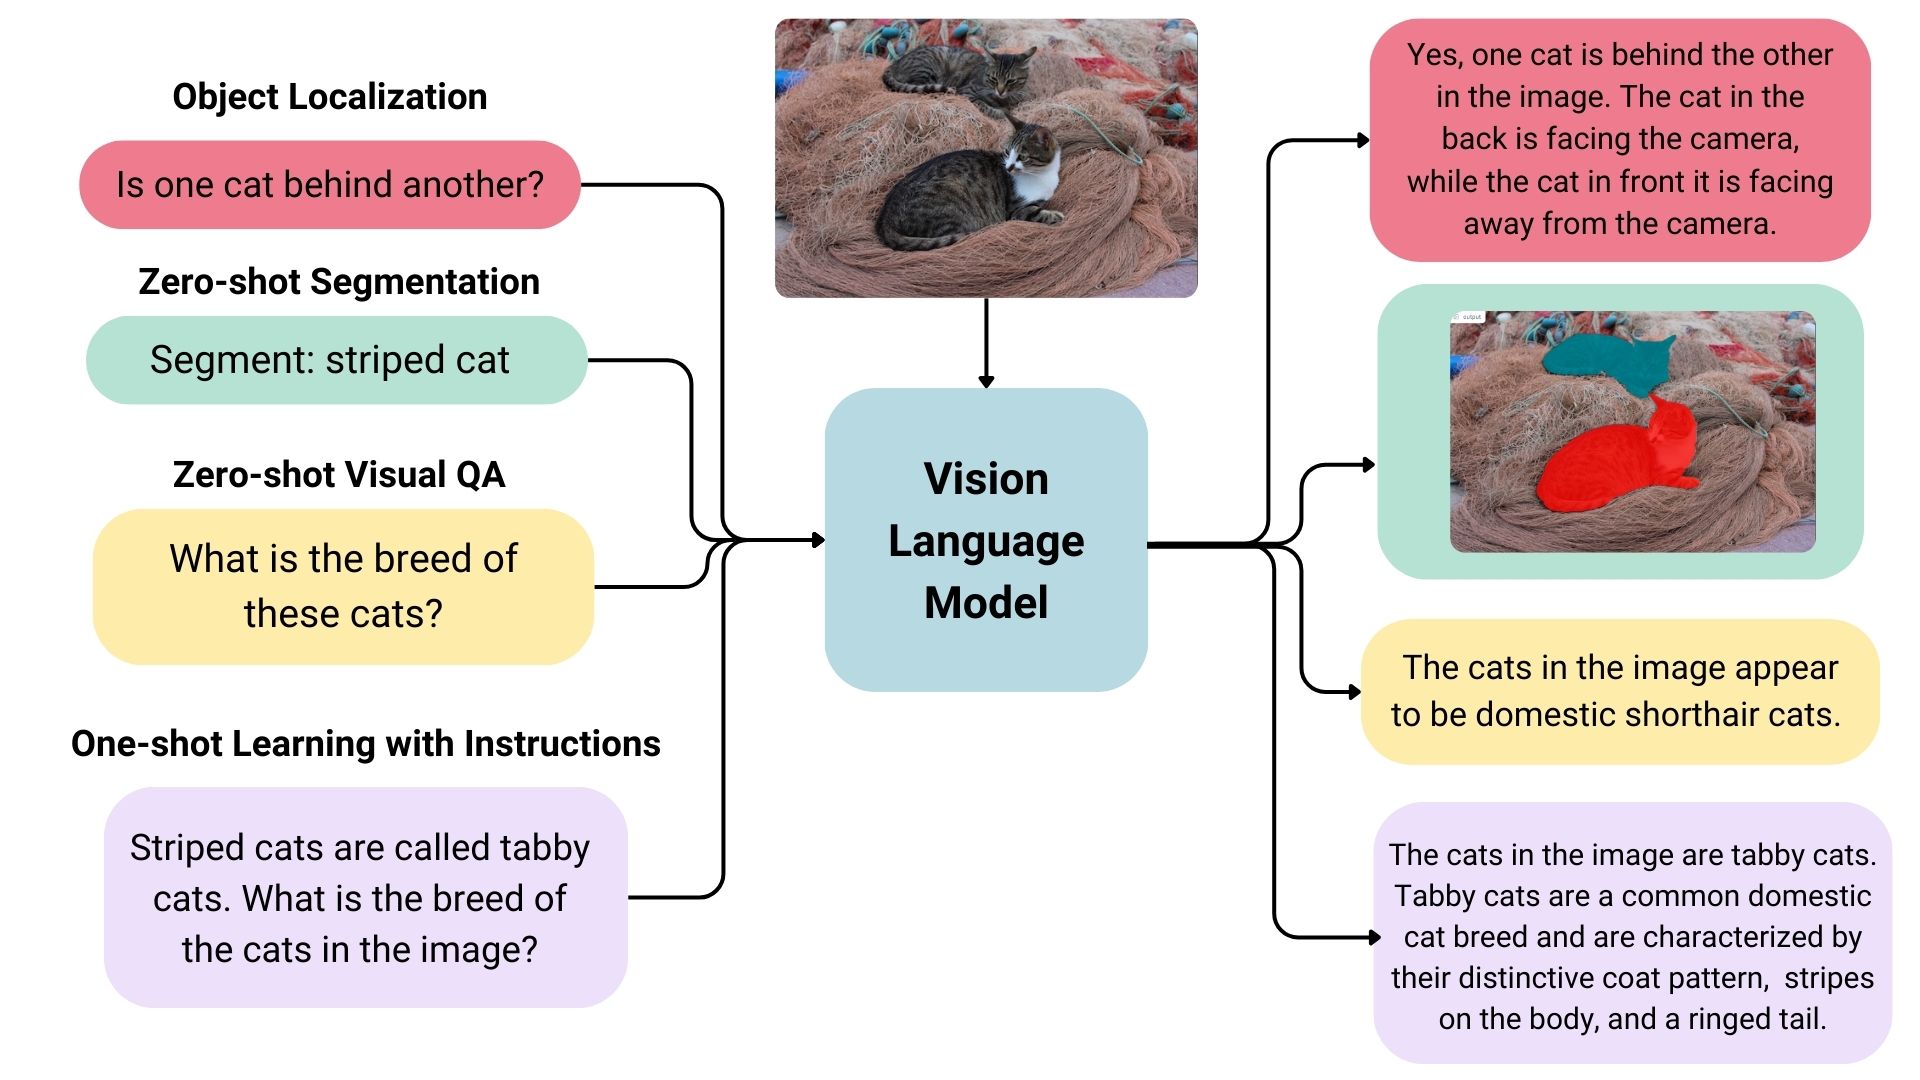
Vision language models are essentially multimodal generative models that process both image and text inputs to produce text outputs. These models are known for their strong zero-shot learning abilities and generalization skills, allowing them to handle various image types, from documents to web pages. They are used for diverse applications including image-based conversations, instruction-based image recognition, document understanding, and generating captions. Some advanced models can even identify spatial relationships within images, producing bounding boxes or segmentation masks to detect or segment specific subjects, and localizing entities or answering questions about their positions. The landscape of vision language models is rich and varied, with differences in training data, image encoding methods, and overall capabilities.
Gemini 1.5 Flash and Pro
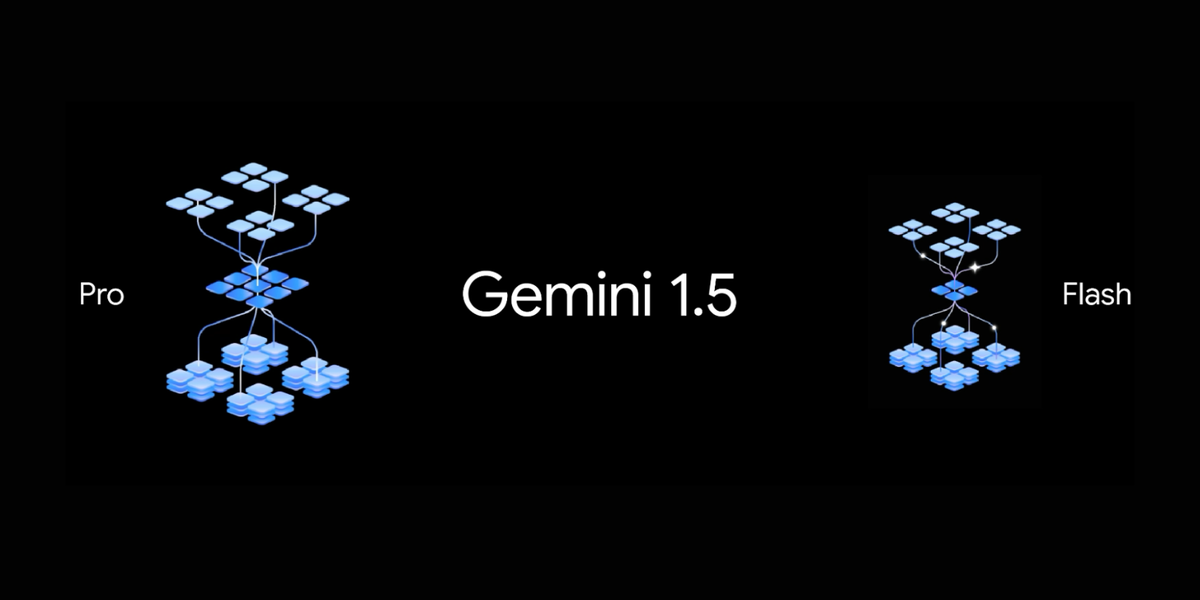
The Gemini 1.5 Flash and Pro models are designed with enhanced multimodal capabilities. They support advanced processing of text, images and audio, making them ideal for tasks requiring an understanding of visual data in conjunction with textual context. Both models allow users to interact with the system using a combination of image and text prompts, making them versatile for data extraction from visual documents like tables, charts, and complex PDF content.
Workflow Example
We begin by installing the necessary package, google-generativeai, and configuring the API key, which is essential for accessing the Generative AI models.
! pip install google-generativeai
Next, we import the google.generativeai module and configure it using your API key, allowing us to interact with the Google Generative AI API.
import google.generativeai as genai
api_key="xxxxxxxxxxxxxxxxxx"
genai.configure(api_key=api_key)
We then initialize the Generative AI model using the Gemini 1.5 Flash variant. This model is capable of understanding and generating structured data. The configuration is set up to output the response in JSON format, which is suitable for table data extraction.
# Using `response_mime_type` requires either a Gemini 1.5 Pro or 1.5 Flash model
gemini_model = genai.GenerativeModel("models/gemini-1.5-flash",
                system_instruction="You are a good data extractor",
                # Set the `response_mime_type` to output JSON
                generation_config={"response_mime_type": "application/json"})
We then define the prompt that instructs the AI to extract table data from the provided image and format it into JSON. The prompt ensures that the output is well-structured, with rows represented as objects and column headers as keys.
prompt = """
Extract the table data from the provided Image and format it as JSON,Ensure that each row is represented as an object, with the column headers as keys and the corresponding cell values as the values.Provide the JSON output with the appropriate structure.
"""
The following function handles the interaction with the Generative AI model. It passes the prompt and the cropped table image to the model, which returns the extracted table data in JSON format. The data is then loaded into a Python dictionary using the json library.
import json

def extract_table(images):
    response = gemini_model.generate_content([prompt,cropped_image])
    data = json.loads(response.text)
    return data
Now, we set up the full pipeline. We first convert PDFs to images and loop through the detected tables in each image. The tables are cropped and passed to the AI model for data extraction. The extracted JSON data is then converted into a Pandas DataFrame and stored for later use.
folder_path = "pdfs"
all_images = convert_pdfs_to_images(folder_path)
tables = []

for image_doc in tqdm(target_images):
  # Detect Tables BBOX
  results = detect_table(image_doc)
  table_bbox = get_table_bbox(results)
  for table in table_bbox:
    # Crop Table Image
    cropped_image = get_cropped_image(image_doc, table, 10)
    # Extract Table Content
    table_data = extract_table(cropped_image)
    df = pd.DataFrame(table_data)
    tables.append(df)
The output is neatly organized into Pandas DataFrames for easy manipulation and analysis.
In this workflow, we’ve demonstrated how to extract table data from PDFs using a combination of image processing, table detection models, and Generative AI. While this approach covers the basics, it’s important to note that more advanced techniques and models are available for even better accuracy and efficiency.
There are more sophisticated detection models specifically fine-tuned for complex table structures, better OCR tools that can handle diverse document types and fonts, and vision-language models (VLMs) optimized for table extraction. As the field evolves, leveraging these improved models can significantly enhance the accuracy and reliability of table data extraction from complex documents.